# Pandas is a software library written for the Python programming language for data manipulation and analysis.
import pandas as pd
#NumPy is a library for the Python programming language, adding support for large, multi-dimensional arrays and matrices, along with a large collection of high-level mathematical functions to operate on these arrays
import numpy as np
Space X Falcon 9 First Stage Landing Prediction
Lab 2: Data wrangling
Estimated time needed: 60 minutes
In this lab, we will perform some Exploratory Data Analysis (EDA) to find some patterns in the data and determine what would be the label for training supervised models.
In the data set, there are several different cases where the booster did not land successfully. Sometimes a landing was attempted but failed due to an accident; for example, True Ocean means the mission outcome was successfully landed to a specific region of the ocean while False Ocean means the mission outcome was unsuccessfully landed to a specific region of the ocean. True RTLS means the mission outcome was successfully landed to a ground pad False RTLS means the mission outcome was unsuccessfully landed to a ground pad.True ASDS means the mission outcome was successfully landed on a drone ship False ASDS means the mission outcome was unsuccessfully landed on a drone ship.
In this lab we will mainly convert those outcomes into Training Labels with 1 means the booster successfully landed 0 means it was unsuccessful.
Falcon 9 first stage will land successfully

Several examples of an unsuccessful landing are shown here:

Objectives
Perform exploratory Data Analysis and determine Training Labels
- Exploratory Data Analysis
- Determine Training Labels
Import Libraries and Define Auxiliary Functions
We will import the following libraries.
Data Analysis
Load Space X dataset, from last section.
df=pd.read_csv("https://cf-courses-data.s3.us.cloud-object-storage.appdomain.cloud/IBM-DS0321EN-SkillsNetwork/datasets/dataset_part_1.csv")
df.head(10)| FlightNumber | Date | BoosterVersion | PayloadMass | Orbit | LaunchSite | Outcome | Flights | GridFins | Reused | Legs | LandingPad | Block | ReusedCount | Serial | Longitude | Latitude | |
|---|---|---|---|---|---|---|---|---|---|---|---|---|---|---|---|---|---|
| 0 | 1 | 2010-06-04 | Falcon 9 | 6104.959412 | LEO | CCAFS SLC 40 | None None | 1 | False | False | False | NaN | 1.0 | 0 | B0003 | -80.577366 | 28.561857 |
| 1 | 2 | 2012-05-22 | Falcon 9 | 525.000000 | LEO | CCAFS SLC 40 | None None | 1 | False | False | False | NaN | 1.0 | 0 | B0005 | -80.577366 | 28.561857 |
| 2 | 3 | 2013-03-01 | Falcon 9 | 677.000000 | ISS | CCAFS SLC 40 | None None | 1 | False | False | False | NaN | 1.0 | 0 | B0007 | -80.577366 | 28.561857 |
| 3 | 4 | 2013-09-29 | Falcon 9 | 500.000000 | PO | VAFB SLC 4E | False Ocean | 1 | False | False | False | NaN | 1.0 | 0 | B1003 | -120.610829 | 34.632093 |
| 4 | 5 | 2013-12-03 | Falcon 9 | 3170.000000 | GTO | CCAFS SLC 40 | None None | 1 | False | False | False | NaN | 1.0 | 0 | B1004 | -80.577366 | 28.561857 |
| 5 | 6 | 2014-01-06 | Falcon 9 | 3325.000000 | GTO | CCAFS SLC 40 | None None | 1 | False | False | False | NaN | 1.0 | 0 | B1005 | -80.577366 | 28.561857 |
| 6 | 7 | 2014-04-18 | Falcon 9 | 2296.000000 | ISS | CCAFS SLC 40 | True Ocean | 1 | False | False | True | NaN | 1.0 | 0 | B1006 | -80.577366 | 28.561857 |
| 7 | 8 | 2014-07-14 | Falcon 9 | 1316.000000 | LEO | CCAFS SLC 40 | True Ocean | 1 | False | False | True | NaN | 1.0 | 0 | B1007 | -80.577366 | 28.561857 |
| 8 | 9 | 2014-08-05 | Falcon 9 | 4535.000000 | GTO | CCAFS SLC 40 | None None | 1 | False | False | False | NaN | 1.0 | 0 | B1008 | -80.577366 | 28.561857 |
| 9 | 10 | 2014-09-07 | Falcon 9 | 4428.000000 | GTO | CCAFS SLC 40 | None None | 1 | False | False | False | NaN | 1.0 | 0 | B1011 | -80.577366 | 28.561857 |
Identify and calculate the percentage of the missing values in each attribute
df.isnull().sum()/df.count()*100FlightNumber 0.000
Date 0.000
BoosterVersion 0.000
PayloadMass 0.000
Orbit 0.000
LaunchSite 0.000
Outcome 0.000
Flights 0.000
GridFins 0.000
Reused 0.000
Legs 0.000
LandingPad 40.625
Block 0.000
ReusedCount 0.000
Serial 0.000
Longitude 0.000
Latitude 0.000
dtype: float64Identify which columns are numerical and categorical:
df.dtypesFlightNumber int64
Date object
BoosterVersion object
PayloadMass float64
Orbit object
LaunchSite object
Outcome object
Flights int64
GridFins bool
Reused bool
Legs bool
LandingPad object
Block float64
ReusedCount int64
Serial object
Longitude float64
Latitude float64
dtype: objectTASK 1: Calculate the number of launches on each site
The data contains several Space X launch facilities: Cape Canaveral Space Launch Complex 40 VAFB SLC 4E , Vandenberg Air Force Base Space Launch Complex 4E (SLC-4E), Kennedy Space Center Launch Complex 39A KSC LC 39A .The location of each Launch Is placed in the column LaunchSite
Next, let’s see the number of launches for each site.
Use the method value_counts() on the column LaunchSite to determine the number of launches on each site:
# Apply value_counts() on column LaunchSite
df.LaunchSite.value_counts()
CCAFS SLC 40 55
KSC LC 39A 22
VAFB SLC 4E 13
Name: LaunchSite, dtype: int64Each launch aims to an dedicated orbit, and here are some common orbit types:
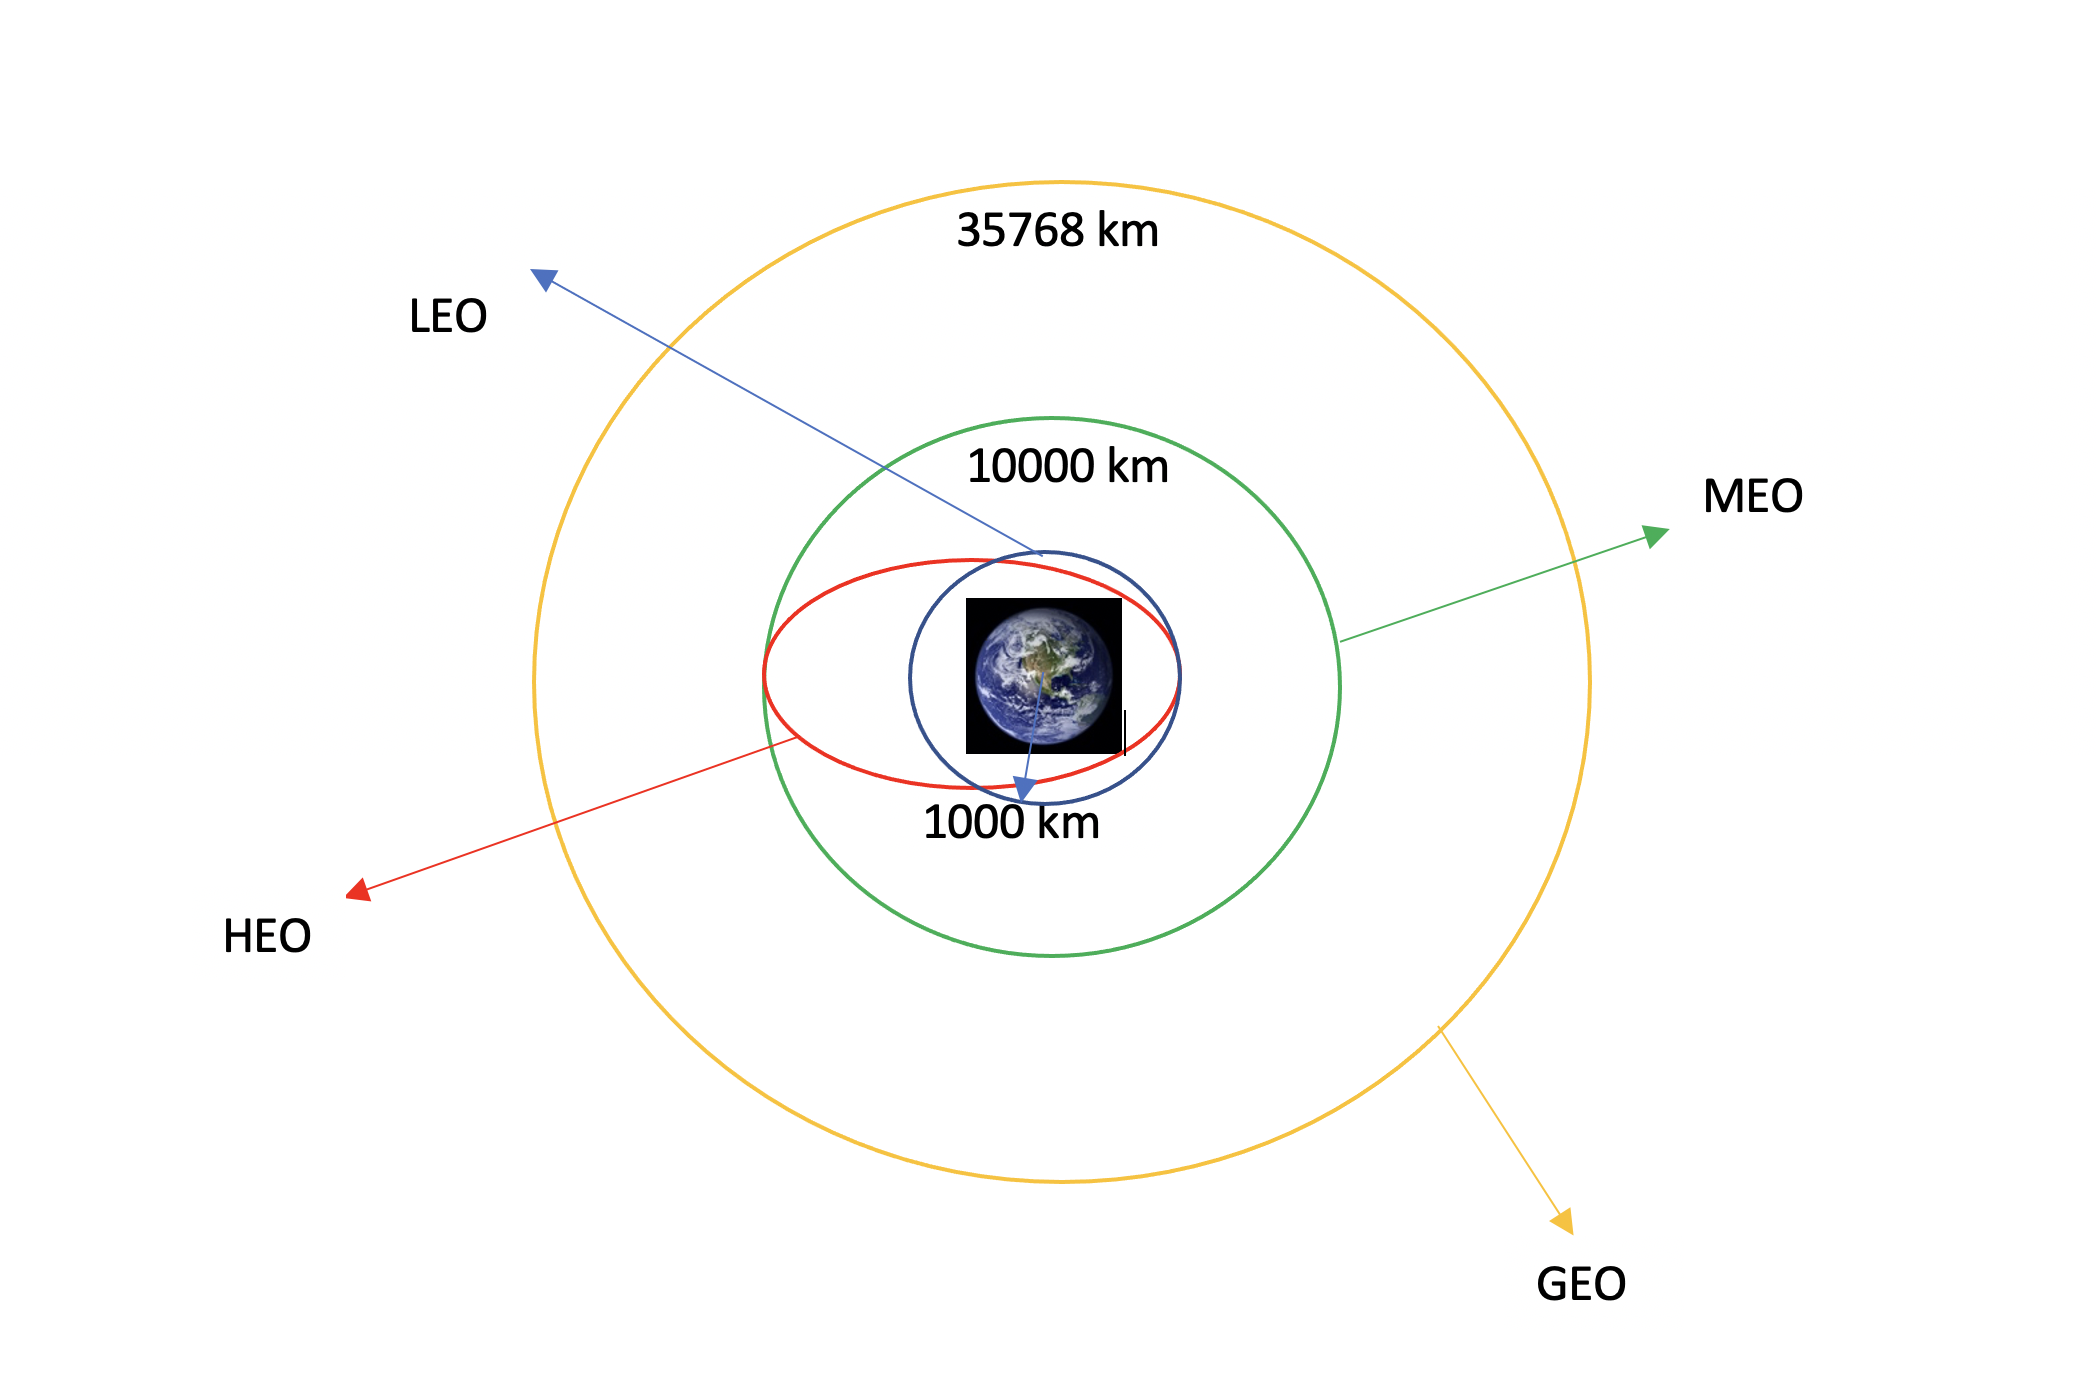
LEO: Low Earth orbit (LEO)is an Earth-centred orbit with an altitude of 2,000 km (1,200 mi) or less (approximately one-third of the radius of Earth),[1] or with at least 11.25 periods per day (an orbital period of 128 minutes or less) and an eccentricity less than 0.25.[2] Most of the manmade objects in outer space are in LEO [1].
VLEO: Very Low Earth Orbits (VLEO) can be defined as the orbits with a mean altitude below 450 km. Operating in these orbits can provide a number of benefits to Earth observation spacecraft as the spacecraft operates closer to the observation[2].
GTO A geosynchronous orbit is a high Earth orbit that allows satellites to match Earth’s rotation. Located at 22,236 miles (35,786 kilometers) above Earth’s equator, this position is a valuable spot for monitoring weather, communications and surveillance. Because the satellite orbits at the same speed that the Earth is turning, the satellite seems to stay in place over a single longitude, though it may drift north to south,” NASA wrote on its Earth Observatory website [3] .
SSO (or SO): It is a Sun-synchronous orbit also called a heliosynchronous orbit is a nearly polar orbit around a planet, in which the satellite passes over any given point of the planet’s surface at the same local mean solar time [4] .
ES-L1 :At the Lagrange points the gravitational forces of the two large bodies cancel out in such a way that a small object placed in orbit there is in equilibrium relative to the center of mass of the large bodies. L1 is one such point between the sun and the earth [5] .
HEO A highly elliptical orbit, is an elliptic orbit with high eccentricity, usually referring to one around Earth [6].
ISS A modular space station (habitable artificial satellite) in low Earth orbit. It is a multinational collaborative project between five participating space agencies: NASA (United States), Roscosmos (Russia), JAXA (Japan), ESA (Europe), and CSA (Canada) [7]
MEO Geocentric orbits ranging in altitude from 2,000 km (1,200 mi) to just below geosynchronous orbit at 35,786 kilometers (22,236 mi). Also known as an intermediate circular orbit. These are “most commonly at 20,200 kilometers (12,600 mi), or 20,650 kilometers (12,830 mi), with an orbital period of 12 hours [8]
HEO Geocentric orbits above the altitude of geosynchronous orbit (35,786 km or 22,236 mi) [9]
GEO It is a circular geosynchronous orbit 35,786 kilometres (22,236 miles) above Earth’s equator and following the direction of Earth’s rotation [10]
PO It is one type of satellites in which a satellite passes above or nearly above both poles of the body being orbited (usually a planet such as the Earth [11]
some are shown in the following plot:
TASK 2: Calculate the number and occurrence of each orbit
Use the method .value_counts() to determine the number and occurrence of each orbit in the column Orbit
# Apply value_counts on Orbit column
df.Orbit.value_counts()
GTO 27
ISS 21
VLEO 14
PO 9
LEO 7
SSO 5
MEO 3
ES-L1 1
HEO 1
SO 1
GEO 1
Name: Orbit, dtype: int64TASK 3: Calculate the number and occurence of mission outcome per orbit type
Use the method .value_counts() on the column Outcome to determine the number of landing_outcomes.Then assign it to a variable landing_outcomes.
# landing_outcomes = values on Outcome column
landing_outcomes = df.Outcome.value_counts()
landing_outcomes
True ASDS 41
None None 19
True RTLS 14
False ASDS 6
True Ocean 5
False Ocean 2
None ASDS 2
False RTLS 1
Name: Outcome, dtype: int64True Ocean means the mission outcome was successfully landed to a specific region of the ocean while False Ocean means the mission outcome was unsuccessfully landed to a specific region of the ocean. True RTLS means the mission outcome was successfully landed to a ground pad False RTLS means the mission outcome was unsuccessfully landed to a ground pad.True ASDS means the mission outcome was successfully landed to a drone ship False ASDS means the mission outcome was unsuccessfully landed to a drone ship. None ASDS and None None these represent a failure to land.
for i,outcome in enumerate(landing_outcomes.keys()):
    print(i,outcome)
0 True ASDS
1 None None
2 True RTLS
3 False ASDS
4 True Ocean
5 False Ocean
6 None ASDS
7 False RTLSWe create a set of outcomes where the second stage did not land successfully:
bad_outcomes=set(landing_outcomes.keys()[[1,3,5,6,7]])
bad_outcomes
{'False ASDS', 'False Ocean', 'False RTLS', 'None ASDS', 'None None'}TASK 4: Create a landing outcome label from Outcome column
Using the Outcome, create a list where the element is zero if the corresponding row in Outcome is in the set bad_outcome; otherwise, it’s one. Then assign it to the variable landing_class:
# landing_class = 0 if bad_outcome
# landing_class = 1 otherwise
landing_class = []
for outcome in df['Outcome']:
    if outcome in bad_outcomes:
        outcome = 0
    else:
        outcome = 1
    landing_class.append(outcome)

landing_class
[0,
0,
0,
0,
0,
0,
1,
1,
0,
0,
0,
0,
1,
0,
0,
0,
1,
0,
0,
1,
1,
1,
1,
1,
0,
1,
1,
0,
1,
1,
0,
1,
1,
1,
0,
1,
1,
1,
1,
1,
1,
1,
1,
1,
1,
0,
0,
0,
1,
1,
0,
0,
1,
1,
1,
1,
1,
1,
1,
0,
0,
1,
1,
1,
1,
1,
1,
0,
1,
1,
1,
1,
0,
1,
0,
1,
0,
1,
1,
1,
1,
1,
1,
1,
1,
1,
1,
1,
1,
1]This variable will represent the classification variable that represents the outcome of each launch. If the value is zero, the first stage did not land successfully; one means the first stage landed Successfully
df['Class']=landing_class
df[['Class']].head(8)| Class | |
|---|---|
| 0 | 0 |
| 1 | 0 |
| 2 | 0 |
| 3 | 0 |
| 4 | 0 |
| 5 | 0 |
| 6 | 1 |
| 7 | 1 |
df.head(5)| FlightNumber | Date | BoosterVersion | PayloadMass | Orbit | LaunchSite | Outcome | Flights | GridFins | Reused | Legs | LandingPad | Block | ReusedCount | Serial | Longitude | Latitude | Class | |
|---|---|---|---|---|---|---|---|---|---|---|---|---|---|---|---|---|---|---|
| 0 | 1 | 2010-06-04 | Falcon 9 | 6104.959412 | LEO | CCAFS SLC 40 | None None | 1 | False | False | False | NaN | 1.0 | 0 | B0003 | -80.577366 | 28.561857 | 0 |
| 1 | 2 | 2012-05-22 | Falcon 9 | 525.000000 | LEO | CCAFS SLC 40 | None None | 1 | False | False | False | NaN | 1.0 | 0 | B0005 | -80.577366 | 28.561857 | 0 |
| 2 | 3 | 2013-03-01 | Falcon 9 | 677.000000 | ISS | CCAFS SLC 40 | None None | 1 | False | False | False | NaN | 1.0 | 0 | B0007 | -80.577366 | 28.561857 | 0 |
| 3 | 4 | 2013-09-29 | Falcon 9 | 500.000000 | PO | VAFB SLC 4E | False Ocean | 1 | False | False | False | NaN | 1.0 | 0 | B1003 | -120.610829 | 34.632093 | 0 |
| 4 | 5 | 2013-12-03 | Falcon 9 | 3170.000000 | GTO | CCAFS SLC 40 | None None | 1 | False | False | False | NaN | 1.0 | 0 | B1004 | -80.577366 | 28.561857 | 0 |
We can use the following line of code to determine the success rate:
df["Class"].mean()0.6666666666666666We can now export it to a CSV for the next section,but to make the answers consistent, in the next lab we will provide data in a pre-selected date range.
df.to_csv(“dataset_part_2.csv”, index=False)
df.to_csv("dataset_part_2.csv", index=False)Change Log
| Date (YYYY-MM-DD) | Version | Changed By | Change Description |
|---|---|---|---|
| 2021-08-31 | 1.1 | Lakshmi Holla | Changed Markdown |
| 2020-09-20 | 1.0 | Joseph | Modified Multiple Areas |
| 2020-11-04 | 1.1. | Nayef | updating the input data |
| 2021-05-026 | 1.1. | Joseph | updating the input data |
Copyright © 2021 IBM Corporation. All rights reserved.